The Appetite Intelligence Gap: Why Most Commercial Submissions Go Unquoted
There is a staggering inefficiency at the center of commercial insurance distribution that almost everyone in the industry acknowledges but few have quantified precisely. The root problem is a carrier appetite intelligence failure: the majority of commercial insurance submissions sent to carriers result in a declination, a "no-thank-you" (NTQ) letter, or no response at all.
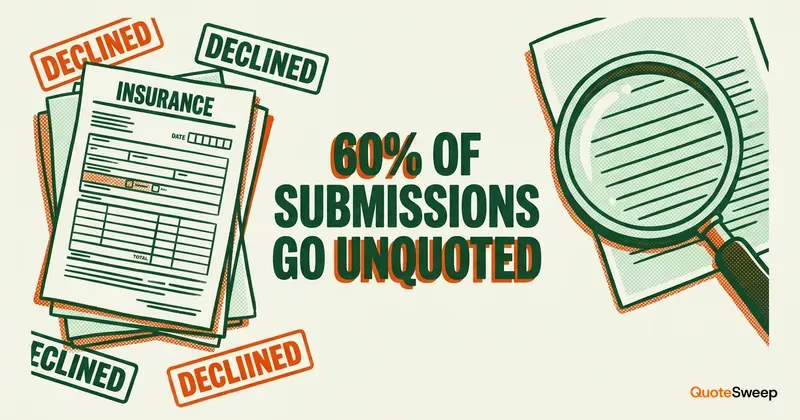
The industry commonly cites that roughly 60% of commercial submissions go unquoted. While precise measurement is difficult – no single data source captures every submission across every carrier – the directional consensus among carriers, agents, and industry analysts is clear: more submissions are declined or ignored than are quoted. Some carrier executives have publicly stated their NTQ rates are even higher for certain lines or risk classes.
This means that the majority of the time agents spend preparing and submitting commercial insurance applications is wasted on carriers that were never going to quote the risk. And the majority of the time carriers spend receiving and reviewing those applications is wasted on risks they were never going to write.
The root cause is an intelligence gap: agents don't have reliable, current, structured data about what each carrier will and won't write – their appetite. This gap costs the industry billions of dollars in wasted effort annually and creates cascading problems for agents, carriers, and insureds alike.
TLDR: A majority of commercial insurance submissions result in a declination or no response. The root cause is the appetite intelligence gap: agents don't have reliable, structured data about what carriers will write. Carrier appetite information is scattered across PDFs, email bulletins, and tribal knowledge – none of it machine-readable. Closing this gap is the single highest-impact efficiency improvement available to commercial insurance distribution.
The Anatomy of a Wasted Submission
To understand the appetite intelligence gap, it helps to trace the lifecycle of a commercial insurance submission that ends in a declination.
Step 1: The Agent Receives a Risk
A prospect walks in – say, a restaurant with three locations, $4 million in revenue, a liquor license, live entertainment, and a valet parking service. The agent needs to place a commercial package: general liability, commercial property, liquor liability, commercial auto, and workers' compensation.
Step 2: The Agent Selects Carriers
The agent has appointments with 15 carriers. Which of those 15 will write a restaurant with this profile? The agent consults several sources:
- Memory and experience. The agent has placed restaurant accounts before and has a general sense of which carriers like restaurants. But appetite changes – a carrier that wrote restaurants last year may have exited the class after poor loss experience.
- Carrier appetite guides. Several carriers publish PDF appetite guides – documents that list the classes of business they write, often organized by SIC or NAICS code. But these guides are typically updated annually (if that), are written in broad strokes ("restaurants – preferred classes only"), and may not reflect current state-specific or limit-specific appetite.
- Marketing rep conversations. The agent's carrier marketing representatives are the most current source of appetite information. But reaching a marketing rep, explaining the risk, and getting a yes/no answer takes time – often a day or more per carrier.
- Carrier bulletins and emails. Carriers periodically send bulletins announcing appetite changes ("effective immediately, we are no longer writing restaurants with liquor sales exceeding 40% of revenue in the state of Florida"). These arrive by email and are easily missed or forgotten.
Based on this imperfect information, the agent selects 8 carriers to submit to – guessing, in part, which ones will actually quote the risk.
Step 3: The Agent Prepares and Submits
For each selected carrier, the agent prepares a submission – completing ACORD applications, gathering loss runs, compiling supplemental information, and entering data into each carrier's portal. In the insurance submission process, this takes 2 to 6 hours for 8 carriers.
Step 4: The Results
Of the 8 submissions: 3 carriers quote the risk. 2 send formal declinations. 2 NTQ (no-thank-you) – simply don't respond, or respond weeks later. 1 requests additional information, extending the process by another week.
Step 5: The Math
Three usable quotes out of 8 submissions. Five were wasted effort. The agent's effective yield on submission time was roughly 40% – and this is a relatively good outcome by industry standards.
Multiply this across every account. An active commercial producer handling 150 to 200 accounts per year, with 5 wasted submissions per account at 30 minutes each, loses 375 to 500 hours per year – roughly a quarter of working hours.
Why Appetite Data Is So Hard
The appetite intelligence gap persists not because the industry lacks awareness of the problem, but because carrier appetite data is inherently complex and resists standardization.
Appetite Is Multi-Dimensional
Carrier appetite is not a simple yes/no list of acceptable industries. It's a multi-dimensional matrix that includes:
| Dimension | Example Variations |
|---|---|
| Class of business | Restaurant vs. fine dining vs. fast food vs. bar/tavern |
| State | Appetite may differ by state due to regulatory environment, loss history, or competitive positioning |
| Revenue / payroll size | A carrier may write restaurants up to $3M in revenue but not above |
| Limits | Appetite for $1M/$2M GL but not $2M/$4M |
| Line of business | Will write the BOP but not the liquor liability; will write the GL but not the umbrella |
| Loss history | No more than 2 claims in 3 years; no claims exceeding $50K |
| Specific exposures | No valet parking; no live entertainment; no swimming pools |
| Carrier capacity | The carrier has written its target premium in this class/state and is no longer actively seeking new business |
| Effective dates | Appetite may change mid-quarter based on loss experience or capacity constraints |
A complete appetite specification for a single carrier across all commercial lines, all states, and all relevant variables would be an enormous dataset. And it changes constantly.
Appetite Communication Is Fragmented
Carriers communicate their appetite through multiple channels, none of which produce structured, machine-readable data:
PDF appetite guides. Typically 10 to 50 page documents listing classes of business the carrier writes, organized by industry group. These are useful as general references but lack the dimensional specificity agents need. They're published annually or semi-annually and are often outdated by the time agents read them.
Email bulletins. When a carrier changes appetite – entering a new class, exiting a state, tightening underwriting guidelines – it typically communicates through email bulletins sent to appointed agents. These bulletins are unstructured text, arrive inconsistently, and are easily lost in an agent's inbox.
Marketing representative conversations. The most current and specific appetite information often comes from conversations with carrier marketing reps. But this information is verbal, not documented, and depends on the rep's knowledge and responsiveness. An agent with a strong marketing rep relationship at a carrier gets better appetite intelligence than an agent who doesn't.
Portal-embedded appetite. Some carrier portals include appetite indicators within the quoting workflow – showing which classes are available in which states before the agent begins entering data. This is useful but only accessible to agents who log into the portal, and it varies in completeness.
Tribal knowledge. Over time, experienced agents accumulate appetite knowledge from repeated submissions – learning through trial and error which carriers will write which risks. This knowledge resides in individual agents' heads, is lost when agents retire or change agencies, and takes years to develop.
The Result: An Unstructured Mess
The cumulative effect is that carrier appetite data – perhaps the most operationally important data in commercial insurance distribution – exists primarily as unstructured information scattered across PDFs, emails, conversations, and individual memory. There is no standardized data model, no common format, no real-time update mechanism, and no centralized source of truth.
This is the appetite intelligence gap.
The Cost of the Gap
The appetite intelligence gap imposes costs on every participant in the commercial insurance distribution chain.
Cost to Agents
Wasted time. As illustrated above, agents spend a substantial portion of their working hours preparing submissions that will be declined. This is time that could be spent on client service, prospecting, or placing business with carriers that will actually quote.
Missed markets. The flip side of submitting to wrong carriers is failing to submit to right carriers. If an agent doesn't know that a regional carrier has entered a new class of business, the agent misses a potential market for their clients. Appetite ignorance works in both directions – it causes wasted submissions to wrong carriers and missed opportunities with right carriers.
E&O risk. When an agent fails to place coverage because they didn't know a carrier would write the risk, the agent faces errors and omissions exposure. If a client suffers a loss and the agent should have known about a viable market, the agent's E&O carrier may not look kindly on "I didn't know they'd write it" as a defense. For more on reducing this risk, see our E&O risk reduction guide.
Client frustration. Clients experience the appetite gap as delays. When an agent submits to 8 carriers and waits two weeks for responses, the client is waiting two weeks for options. If 5 of those 8 were never going to quote, the agent could have placed the business faster by submitting only to the 3 viable carriers – if they had known which 3 those were.
Cost to Carriers
Submission processing cost. Carriers invest resources in receiving, reviewing, and declining submissions. Underwriters who spend their time declining risks that should never have been submitted are not spending that time underwriting risks they'll actually write. Industry estimates suggest that the per-submission processing cost – including underwriter time, system costs, and administrative overhead – ranges from tens to hundreds of dollars depending on complexity.
Underwriter frustration. Carrier underwriters consistently report that a large portion of their incoming submissions are outside appetite. This creates frustration, contributes to underwriter burnout, and reduces the time available for careful underwriting of viable submissions.
Adverse selection risk. When agents submit broadly to many carriers without appetite knowledge, the submissions that arrive at any given carrier are less well-matched to that carrier's risk preferences. This can contribute to adverse selection – the carrier receives a disproportionate share of risks at the margins of its appetite, which may lead to worse loss experience.
Cost to Insureds
Delayed coverage. The business that needs insurance coverage is the ultimate victim of the appetite gap. A process that should take days extends to weeks because submissions are bouncing around the market, being declined, and being resubmitted.
Incomplete market access. If an agent only submits to carriers they're confident will quote – a rational response to repeated declinations – the insured may not get the benefit of the agent's full carrier panel. Better appetite intelligence would give the agent confidence to submit to carriers they might otherwise skip.
Current Approaches to Appetite Management
The industry has developed several partial approaches to the appetite problem, none of which fully close the gap.
Carrier appetite guides (PDF). The most common format. Carriers publish PDF documents listing appetite by class of business. These are useful starting points but quickly outdated (published annually; appetite changes quarterly), insufficiently granular ("restaurants – preferred classes" doesn't tell an agent whether a specific restaurant qualifies), not machine-readable, and inconsistently formatted across carriers.
Appetite aggregators. Several companies have attempted to aggregate carrier appetite into searchable databases. The challenge is the same one agents face: the underlying data is not standardized, changes frequently, and is communicated inconsistently. The resulting databases are often incomplete or outdated.
Marketing rep networks. Formalizing marketing rep relationships improves appetite intelligence but doesn't scale. An agency with 30 carrier appointments can't have a weekly call with 30 marketing reps for every submission.
Submission management platforms. Some platforms include basic appetite filtering – showing which carriers accept a given class code. This covers only the broadest parameters (class and state) without the dimensional depth needed to prevent most declinations.
Trial and error. Many agents submit broadly and learn from results. Over time, they build a mental model of which carriers write what. This is the most common "approach" in practice, and it's inherently wasteful – the learning comes at the cost of declined submissions.
What Structured Appetite Intelligence Looks Like
Closing the appetite intelligence gap requires transforming carrier appetite data from unstructured information scattered across documents and conversations into structured, machine-readable data that can be programmatically matched against risk characteristics before a submission is prepared.
The Data Model
A structured appetite data model would capture carrier appetite across all relevant dimensions:
Carrier: Hartford
Line: BOP
State: Connecticut
Class codes: [5812 - Eating Places, 5813 - Drinking Places]
Revenue range: $500K - $10M
Acceptable exposures: Liquor (up to 40% of revenue), outdoor dining
Excluded exposures: Live entertainment, valet parking, hookah
Limits: Up to $2M/$4M
Loss requirements: No more than 3 claims / 5 years, no single claim > $75K
Status: Active
Last verified: 2026-03-01
Confidence: High (verified via API/portal)
This structured representation enables automated matching: given a risk profile, the system can identify which carriers have appetite before any submission work begins. This is automated appetite checking – the ability to answer "which of my carriers will write this risk?" in seconds rather than hours.
Sources of Structured Appetite Data
Building and maintaining structured appetite data requires combining multiple sources:
1. Carrier APIs and portals. Carriers that have quoting APIs or portals with appetite indicators can be queried programmatically. If a carrier's portal shows that a class code is available in a state, that's a machine-verifiable appetite signal.
2. Submission outcomes. Every declination is an appetite data point. If Carrier X declines a restaurant in Florida with liquor sales exceeding 40%, that constrains the appetite model for Carrier X. Over thousands of submissions, outcome data builds a detailed appetite map.
3. Carrier-provided data. Some carriers are willing to share appetite data in structured formats – spreadsheets, data files, or API feeds – if asked. The challenge is standardization and update frequency, but carrier cooperation is increasing as carriers recognize the cost of mismatched submissions.
4. Marketing rep intelligence. Conversations with marketing reps can be captured and structured – turning verbal appetite updates into data points that update the appetite model. This requires process discipline but converts the most current appetite information into usable data.
5. Public filings and announcements. State insurance department filings, rate filings, and carrier announcements about market entry or exit contain appetite signals that can be systematically captured.
Observed Appetite vs. Published Appetite: Why Outcomes Beat Guides
The five sources above aren't equally valuable. Submission outcome data, meaning what carriers actually quoted, declined, or NTQ'd, is the most valuable signal because it captures the gap between what carriers say they write and what they actually write.
Published appetite is a marketing surface. PDF guides are deliberately wide, portal indicators show class eligibility but rarely the harder boundaries (revenue cutoffs, exposure exclusions, loss-history thresholds), and marketing rep statements are framed to keep submissions flowing. The actual underwriting decisions are narrower, shift faster, and reflect things the carrier won't put in a guide: capacity constraints, recent loss experience in a class, a state pulling back, a reinsurance treaty change.
Observed appetite, extracted from real submission outcomes at scale, closes that gap.
The clearest illustration of why this matters comes from outside commercial. In personal auto, a carrier called Assurance America built its entire business model around a single observation: it watches what Progressive is doing, then prices roughly five percent under. If a driver is one or two points off qualifying for Progressive's preferred pricing, Assurance America is the next stop. Their published underwriting guide is essentially a paragraph; the rest is observed-decision data, refined continuously.
That positioning only works if you can see Progressive's actual decisions, not their published appetite. Commercial insurance has the same structure, just less concentrated. Every regional and specialty carrier wants to know which classes the national carriers are actively writing right now, where they're tightening, and where the cracks are. A carrier asking "where is Travelers pulling back on contractors this quarter?" can't get a useful answer from Travelers' published appetite guide. They can get one from observed decisions across thousands of submissions.
This is one of the reasons appetite intelligence is more than an agent-side workflow tool. The same observed-decision dataset that helps an agent pick the right three carriers to submit to is, from a different angle, a market-positioning signal that smaller carriers will pay to access.
A caveat: this kind of intelligence is only useful at scale. A handful of submission outcomes is anecdote. Tens of thousands of outcomes across hundreds of carriers, refreshed continuously, becomes a structural map of the commercial market.
The Matching Problem
With structured appetite data in place, the matching problem becomes tractable. Given an input risk profile (class, state, revenue, exposures, loss history, requested limits), the system can:
- Filter to eligible carriers – carriers with active appetite for the class in the state
- Score by fit – rank carriers by how well the risk matches their preferred profile (not just whether it falls within appetite, but how central it is to the carrier's preferred book)
- Flag exclusions – identify specific risk characteristics that would trigger a decline at specific carriers
- Recommend submission order – prioritize carriers most likely to quote competitively
This transforms the agent's carrier selection from an educated guess into a data-driven decision.
The Network Effect of Appetite Data
Appetite intelligence has a network effect that amplifies its value as more participants contribute data.
Every submission outcome – quoted, declined, NTQ'd – is a data point that refines the appetite model. A platform processing thousands of submissions per month across dozens of carriers accumulates appetite intelligence far faster than any individual agent or carrier could. As the model covers more carriers, agents can make better selection decisions across their full panel. As more agents use the tools, geographic and class-of-business coverage improves. An agent in rural Wyoming submitting a niche risk class contributes data that benefits other agents with similar risks.
This network dynamic means that early movers in structured appetite intelligence have a compounding advantage. The first platform to build a comprehensive, accurate appetite model becomes the hardest to displace – because its data advantage grows with every submission.
Impact at Scale
To make the appetite gap tangible: a 5-person agency handling 300 commercial accounts per year, with an average of 4 wasted submissions per account at 30 minutes each, is losing roughly 600 hours per year to unproductive submission work. That's the equivalent of roughly 20% of a full-time employee spent preparing applications for carriers that were never going to quote.
On the carrier side, a mid-sized regional carrier receiving tens of thousands of submissions per year – a majority outside appetite – spends millions annually processing submissions it will decline. Each declination costs the carrier in underwriter time, system resources, and administrative overhead.
And the business owner waiting for coverage? When an agent submits to 10 carriers and 6 decline because the contractor's specific trade is outside their appetite, a process that could take a week takes three. With appetite intelligence, the agent identifies the viable carriers on day one.
QuoteSweep's Appetite Data Model
QuoteSweep has built a structured appetite data model that combines carrier-provided data, portal-derived signals, and submission outcome data to enable automated appetite checking before any quoting begins.
When an agent enters a risk profile into QuoteSweep, the system matches the risk against the appetite model and identifies which carriers on the agent's panel are likely to quote – before initiating any carrier portal automation or API submissions. This pre-submission filtering eliminates wasted automation cycles and focuses the agent's time on carriers that will actually return quotes.
The appetite model is continuously updated as new submission outcomes are processed, creating the network effect described above. Every quote, declination, and NTQ refines the model's accuracy for future submissions with similar risk characteristics.
The Path Forward
Closing the appetite intelligence gap requires cooperation across the industry. Carriers need to make appetite data more accessible – not necessarily through APIs, but by publishing in structured, machine-readable formats and providing update notifications when appetite changes. Technology platforms need to invest in appetite data infrastructure, recognizing that the platform with the best appetite data delivers the best submission-to-quote ratios. Agents need to demand appetite intelligence from their tools rather than accepting the status quo of broad submission and hope. And industry standards bodies like ACORD and IVANS need to define appetite data formats the way they've standardized other insurance data.
The appetite intelligence gap is not a permanent condition. It's a solvable problem that persists because the data infrastructure hasn't been built. The economics are compelling: industry waste from mismatched submissions is measured in billions of dollars, and the technology to address it exists today. The question is not whether the gap will close, but who will close it – and who will benefit from having done so first.
Frequently Asked Questions
What percentage of commercial insurance submissions are declined?
Industry consensus suggests that a majority of commercial insurance submissions – commonly cited as roughly 60% – result in a declination, a no-thank-you (NTQ), or no response. The exact figure varies by line of business, risk class, and how "submission" is defined, but the directional finding is consistent across industry surveys and carrier reports: more submissions are declined than quoted.
Why can't agents just call their marketing rep to check appetite?
They can, and many do – but it doesn't scale. An agent with 15 carrier appointments would need to contact 15 marketing reps for each new account to get current appetite guidance. Marketing reps may take hours or days to respond. And verbal appetite confirmations don't prevent the agent from submitting to a carrier that has quietly changed its appetite since the last conversation. Structured appetite data automates what marketing rep calls do manually, but faster and with more consistency.
What is automated appetite checking?
Automated appetite checking is the ability to programmatically match a risk profile (class of business, state, revenue, exposures, loss history) against a structured database of carrier appetite data. The system identifies which carriers are likely to quote the risk before any submission work begins. This eliminates wasted submissions to carriers that would decline and ensures agents don't miss carriers that would have quoted competitively.
How does carrier appetite data stay current?
In a structured appetite intelligence system, data stays current through multiple channels: real-time signals from carrier APIs and portals, submission outcome tracking (every declination updates the model), carrier-provided updates, and monitoring of carrier bulletins and state filings. The most effective systems treat appetite data as a continuously updated model rather than a static database, with each new data point refining the model's accuracy.
Does the appetite gap affect all lines of commercial insurance equally?
No. The gap is most severe in specialty and surplus lines, where carrier appetite is narrowest and most variable. It's less severe in standard small commercial (BOP, GL, workers' comp) where many carriers have broad, stable appetite. The gap is also more pronounced for complex risks (restaurants with liquor, contractors in high-hazard trades, businesses with significant claims history) where carrier appetite conditions are more nuanced and harder to predict from general appetite guides.